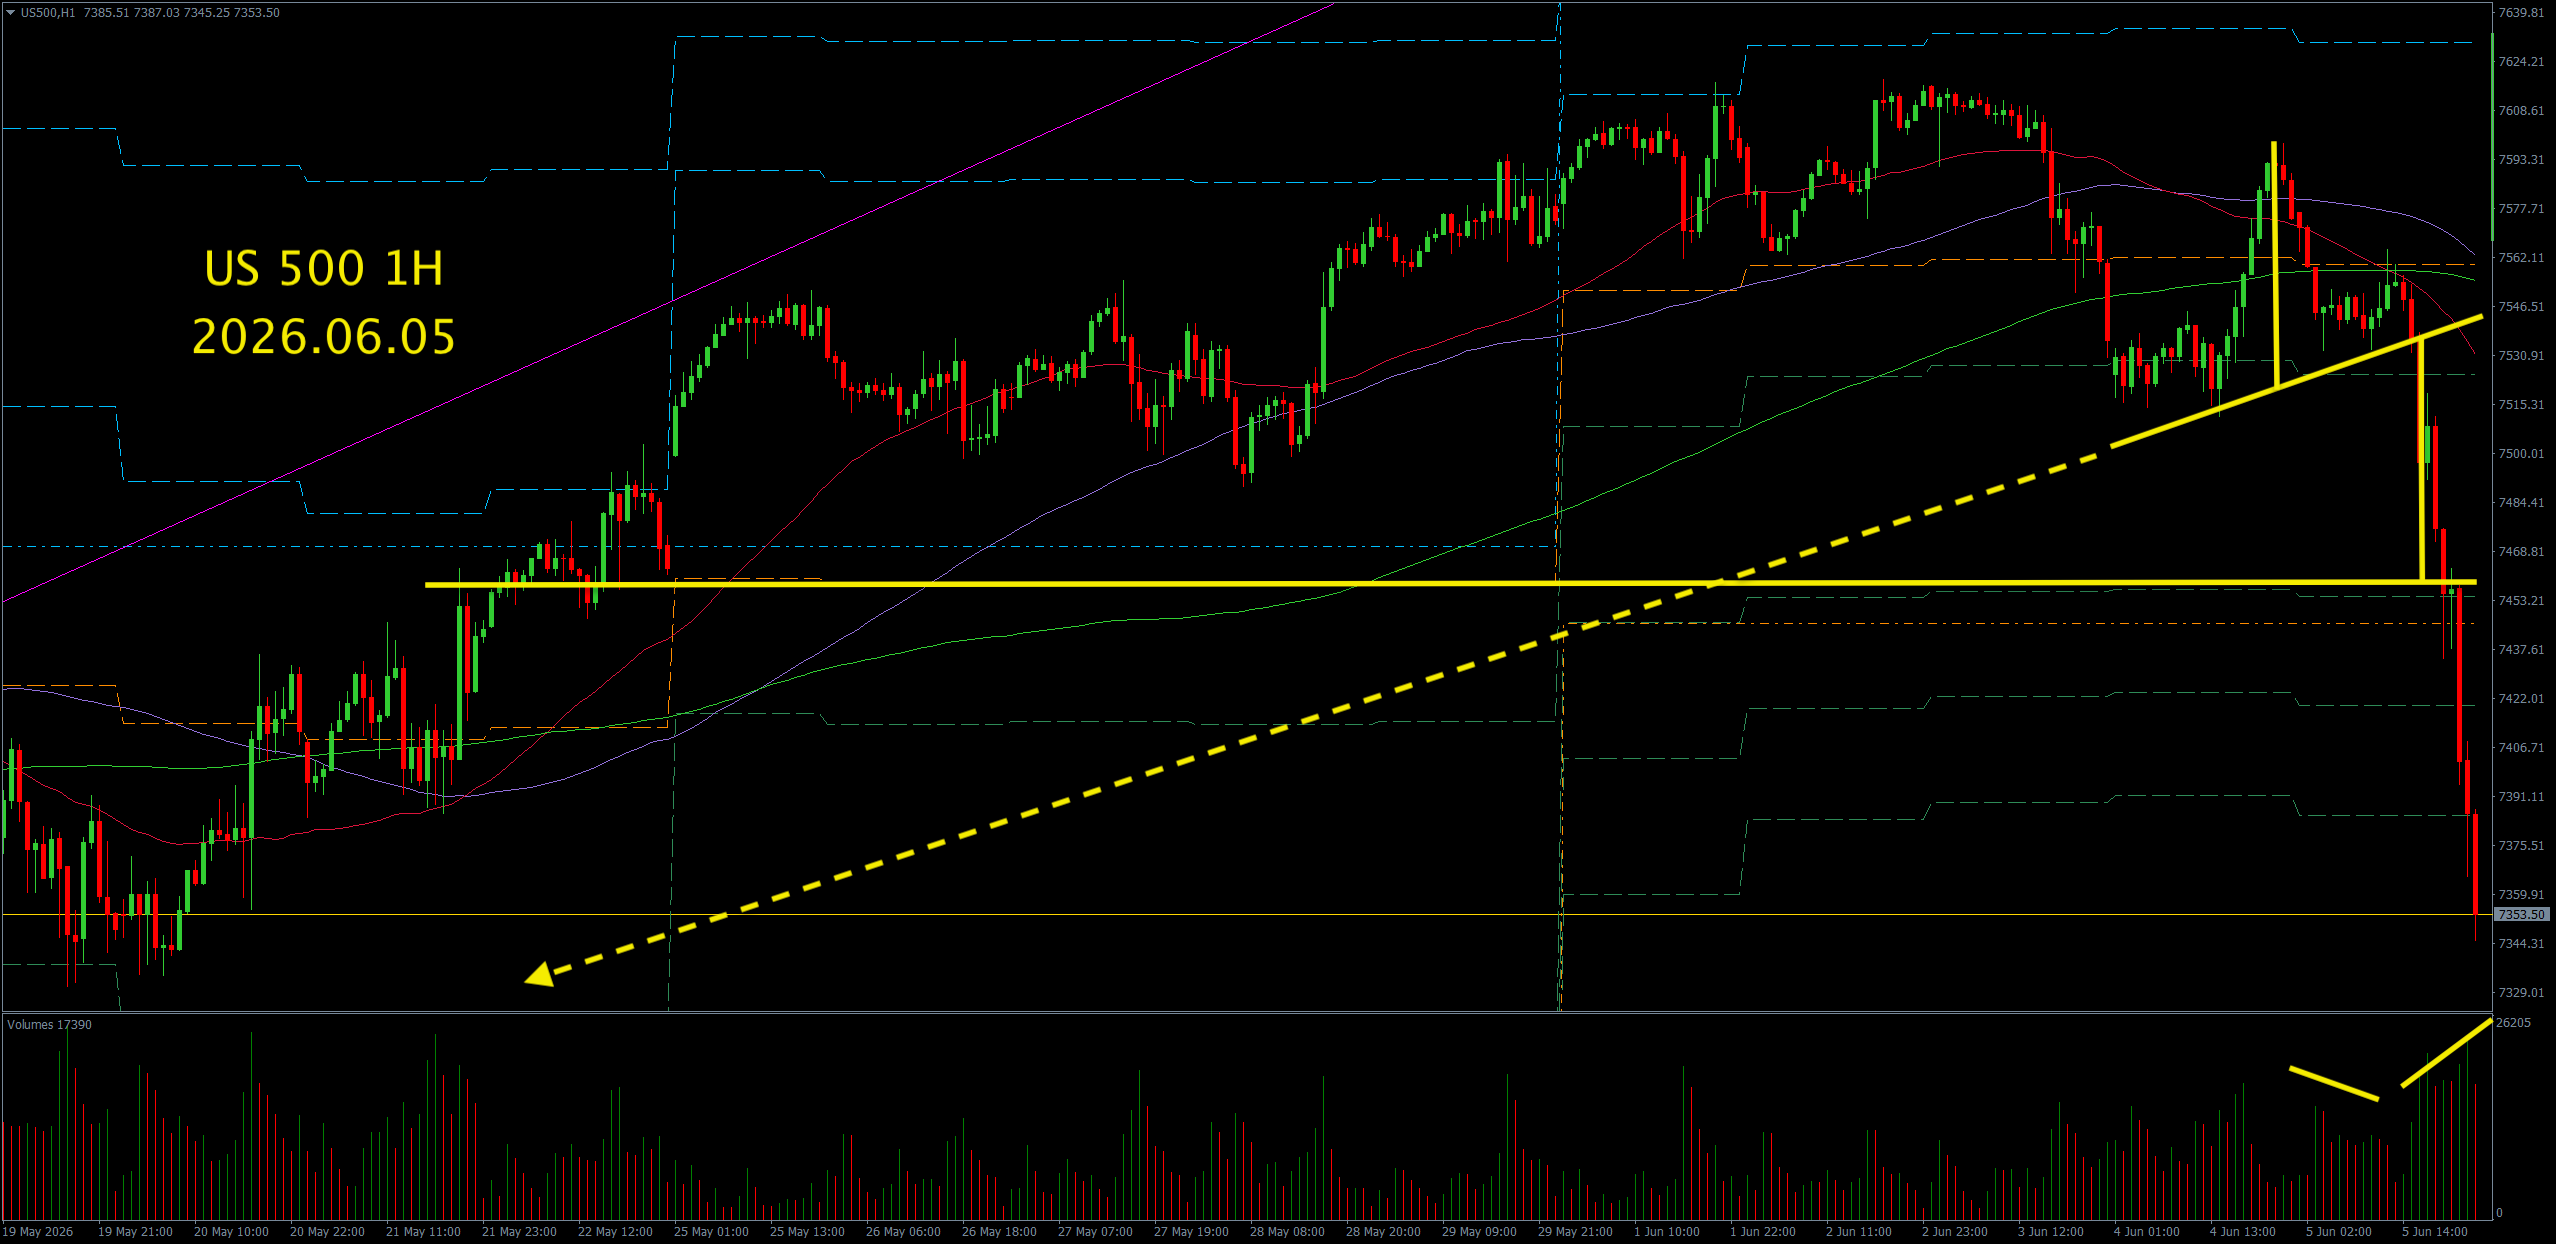
S&P Sell-Off Head & Shoulders
Classic Head & Shoulders a Distribution Trap
Please support our work by considering AvaTrade our affiliate partners. Step into global markets and trade with confidence across Stocks, Crypto, FX, Commodities, Indices and more. AVATRADE are a Highly regulated multi-asset broker. We may receive a commission.

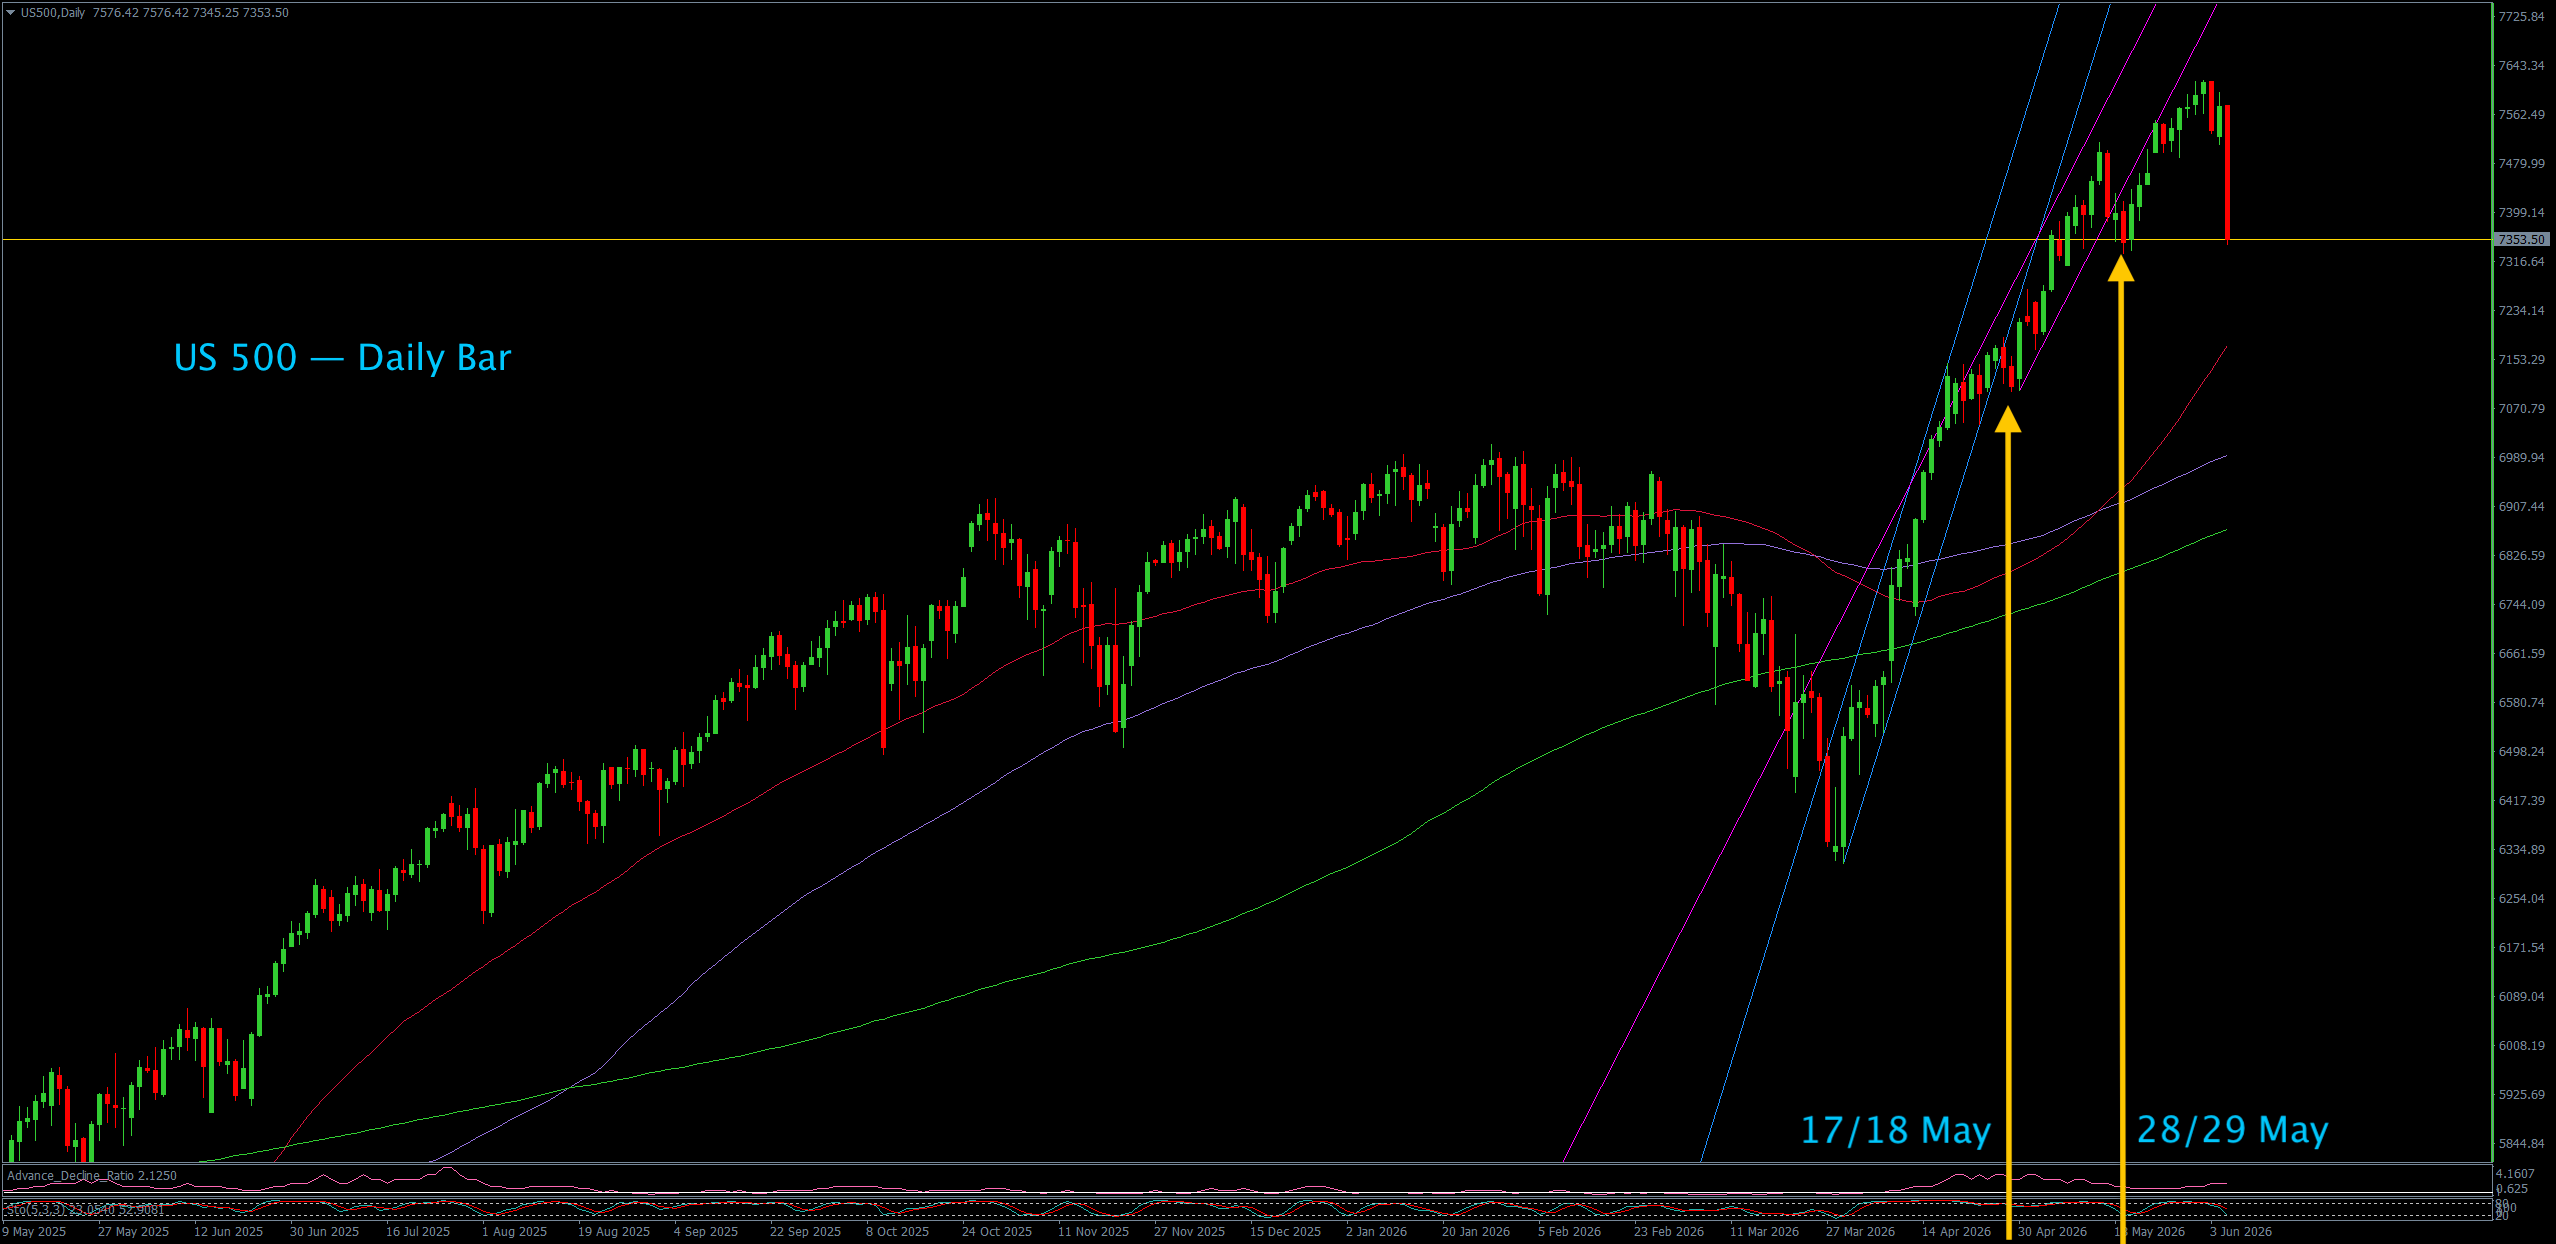
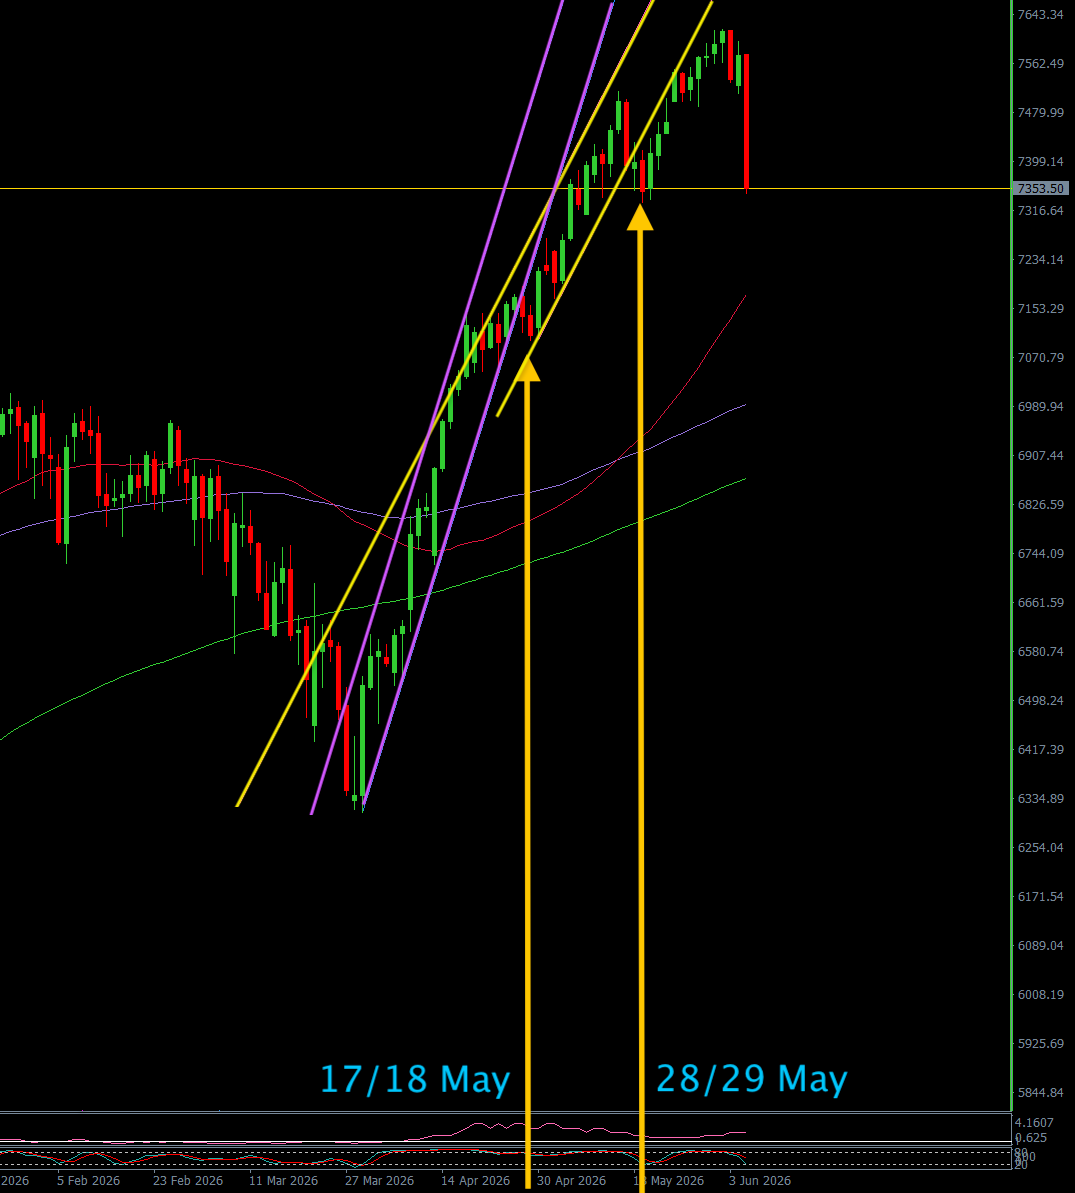
This classic Head and Shoulders pattern is the climax of a plan that was put in action well in advance of the day it occurred. You can see where this began on the left hand chart. The channel marking the upward trend that the market had been following since early March was broken by a flag formation on the 17/18th May. This is the first sign of the the “smart money”, the composite operator.
The head and shoulders pattern is a distribution formation. The market hits the top of the long term channel and moves side ways, accumulation, forming a new, flatter channel. On the 17th May we see a dip that is the spring before mark-up. The market shifts channel again on the 28th May. After this the demand line becomes resistance.
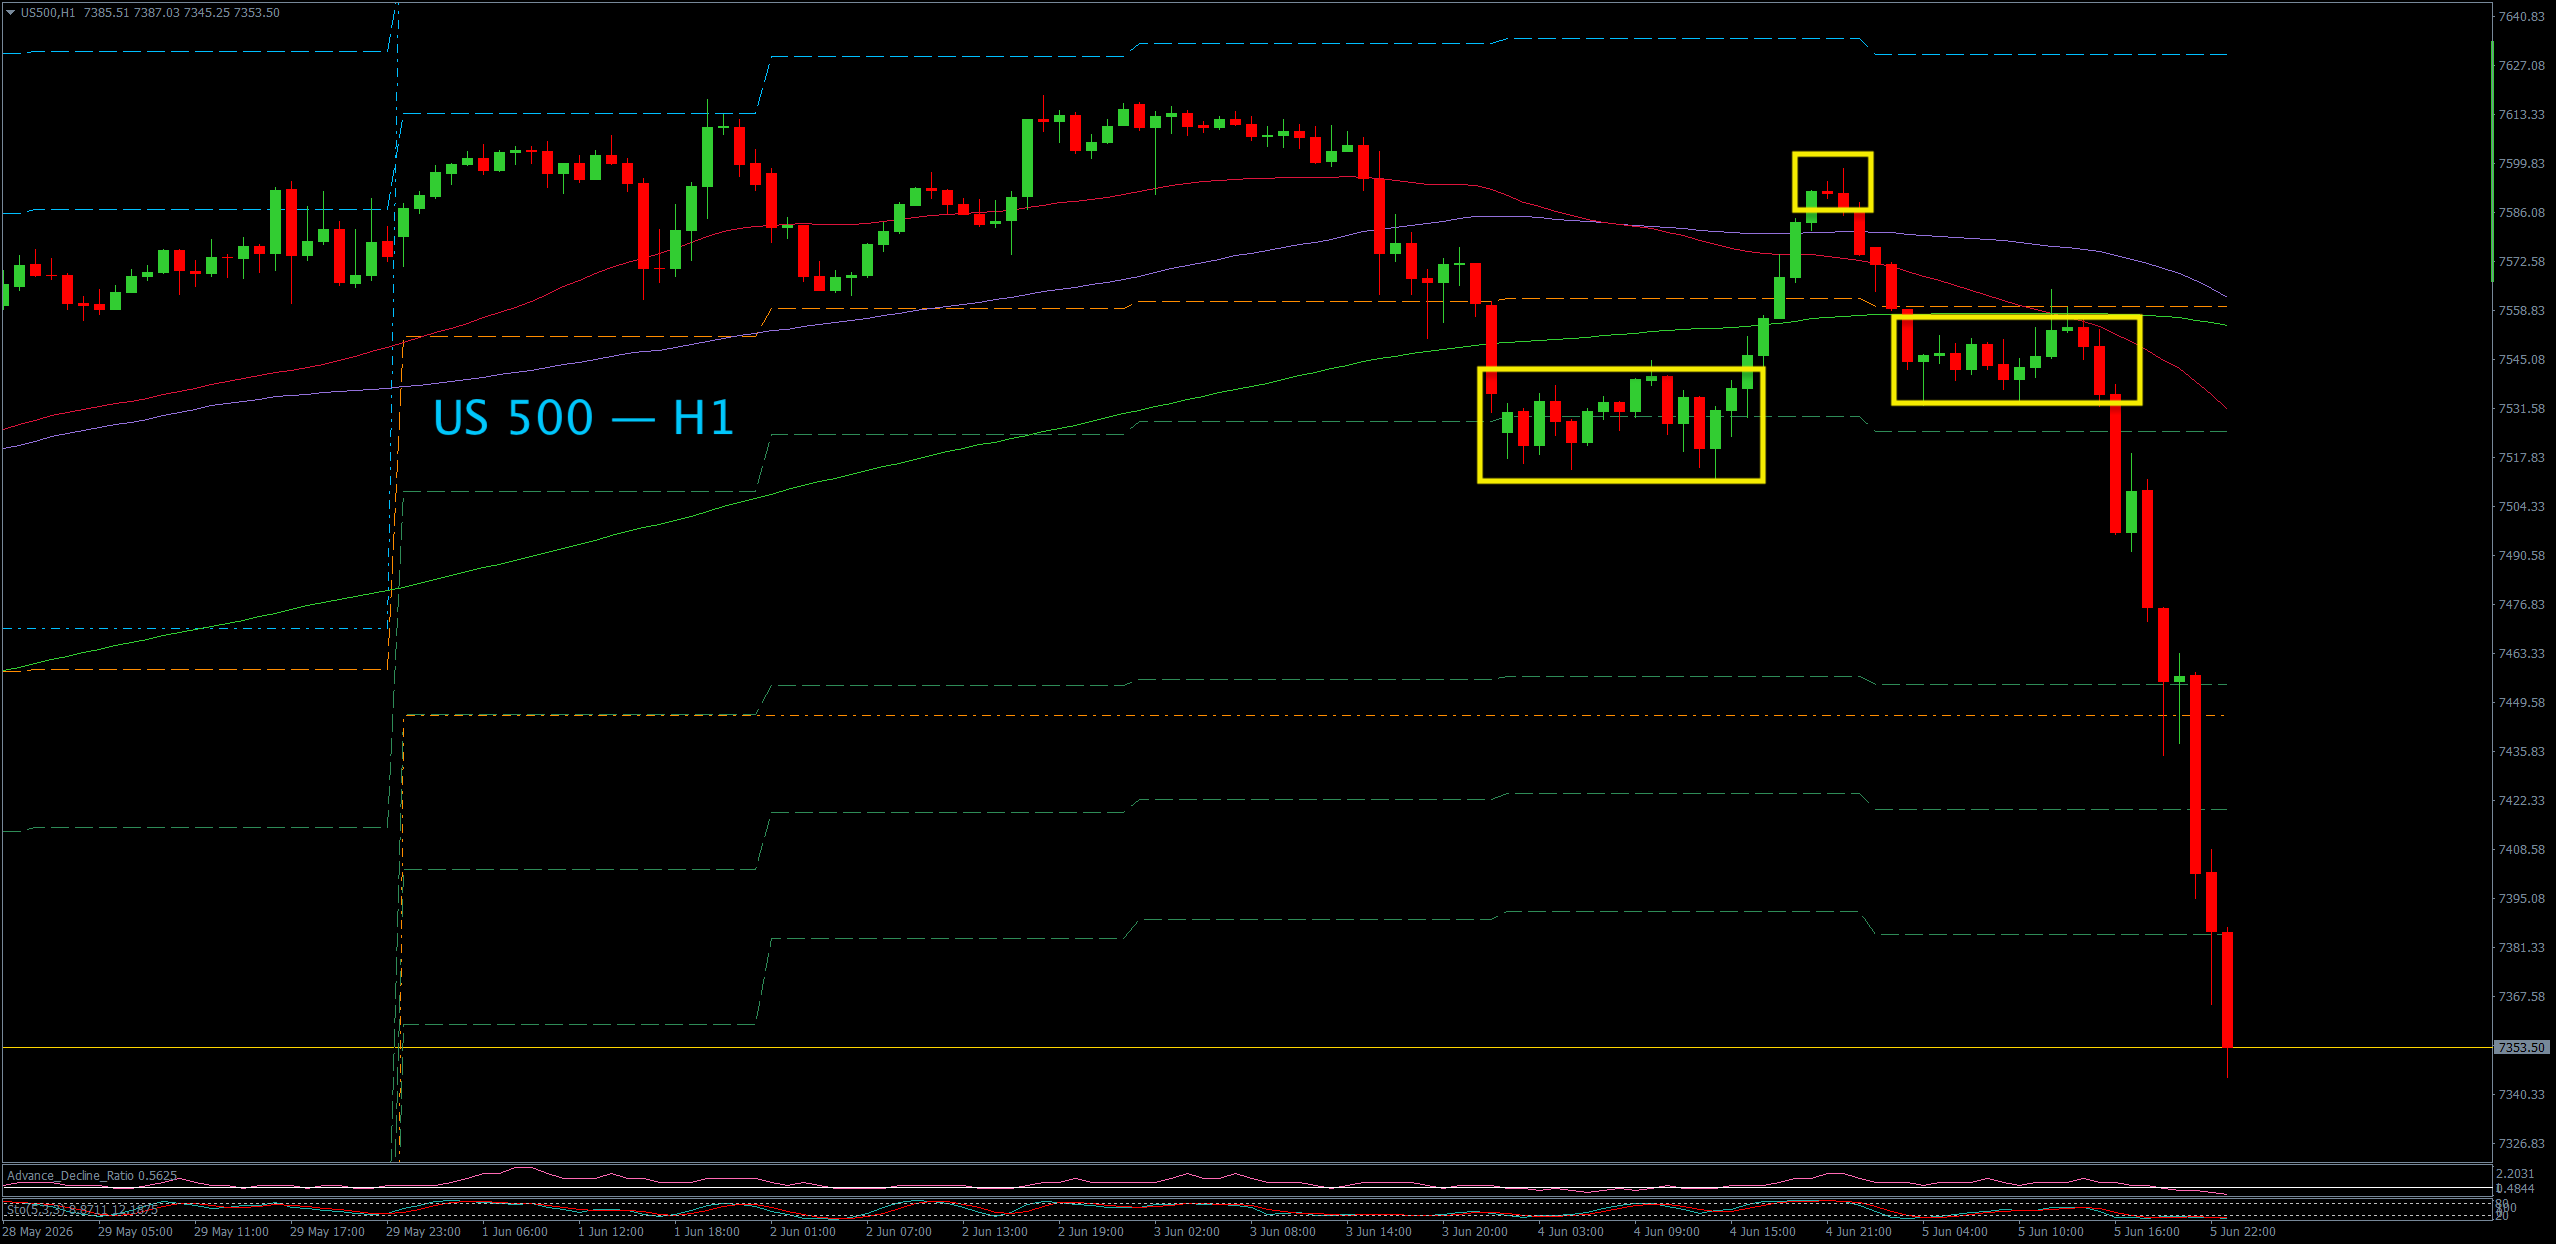
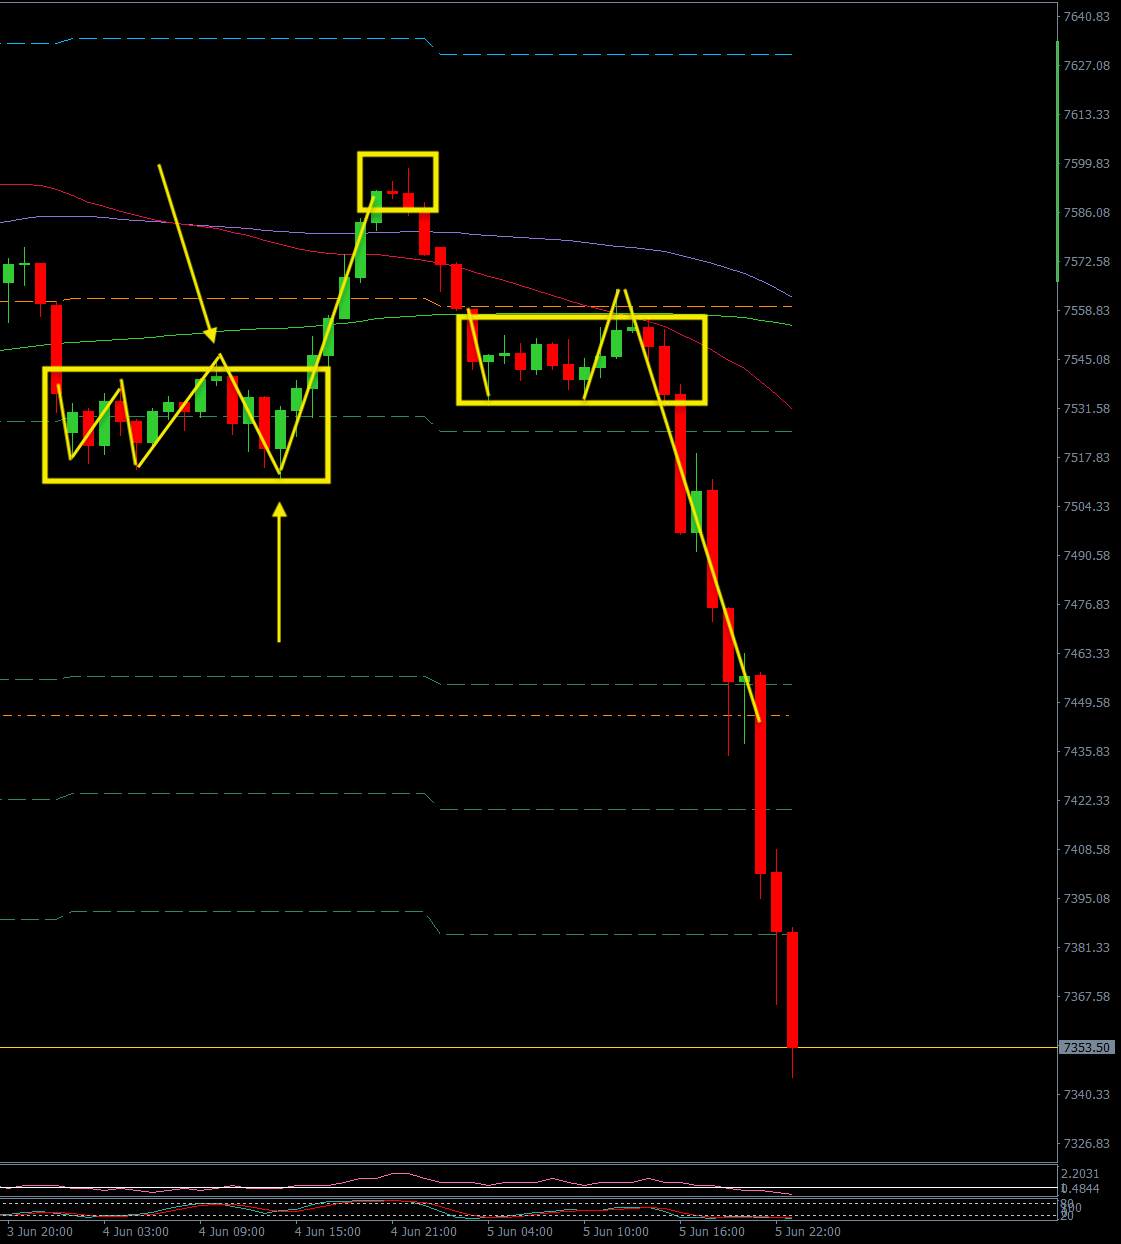
Moving over to the chat on the right, H1 timeframe. Weak hands think the market is selling off and no doubt buy into that. Then suddenly there is a selling climax, the down trend stops and we enter a enter into a period of accumulation. The price rallies then there is a sudden stop at the high and reversal — another direction change. Accumulation forms the left shoulder. Pushing the market lower mimics a short. It’s position to a price where they want to accumulate. They take the market higher taking out weak-hands and short stops with it.
A harami forms the head and marks a sudden stop and reversal moving lower to a selling climax. That’s another sudden stop followed by eleven days of accumulation that forms the right hand shoulder. There is a test of the high before the market sells-of, distribution.
The opposite of this manoeuvre is an Inverse Head and Shoulders pattern that forms at the bottom of a down trend. Both patterns share many of the same characteristics.
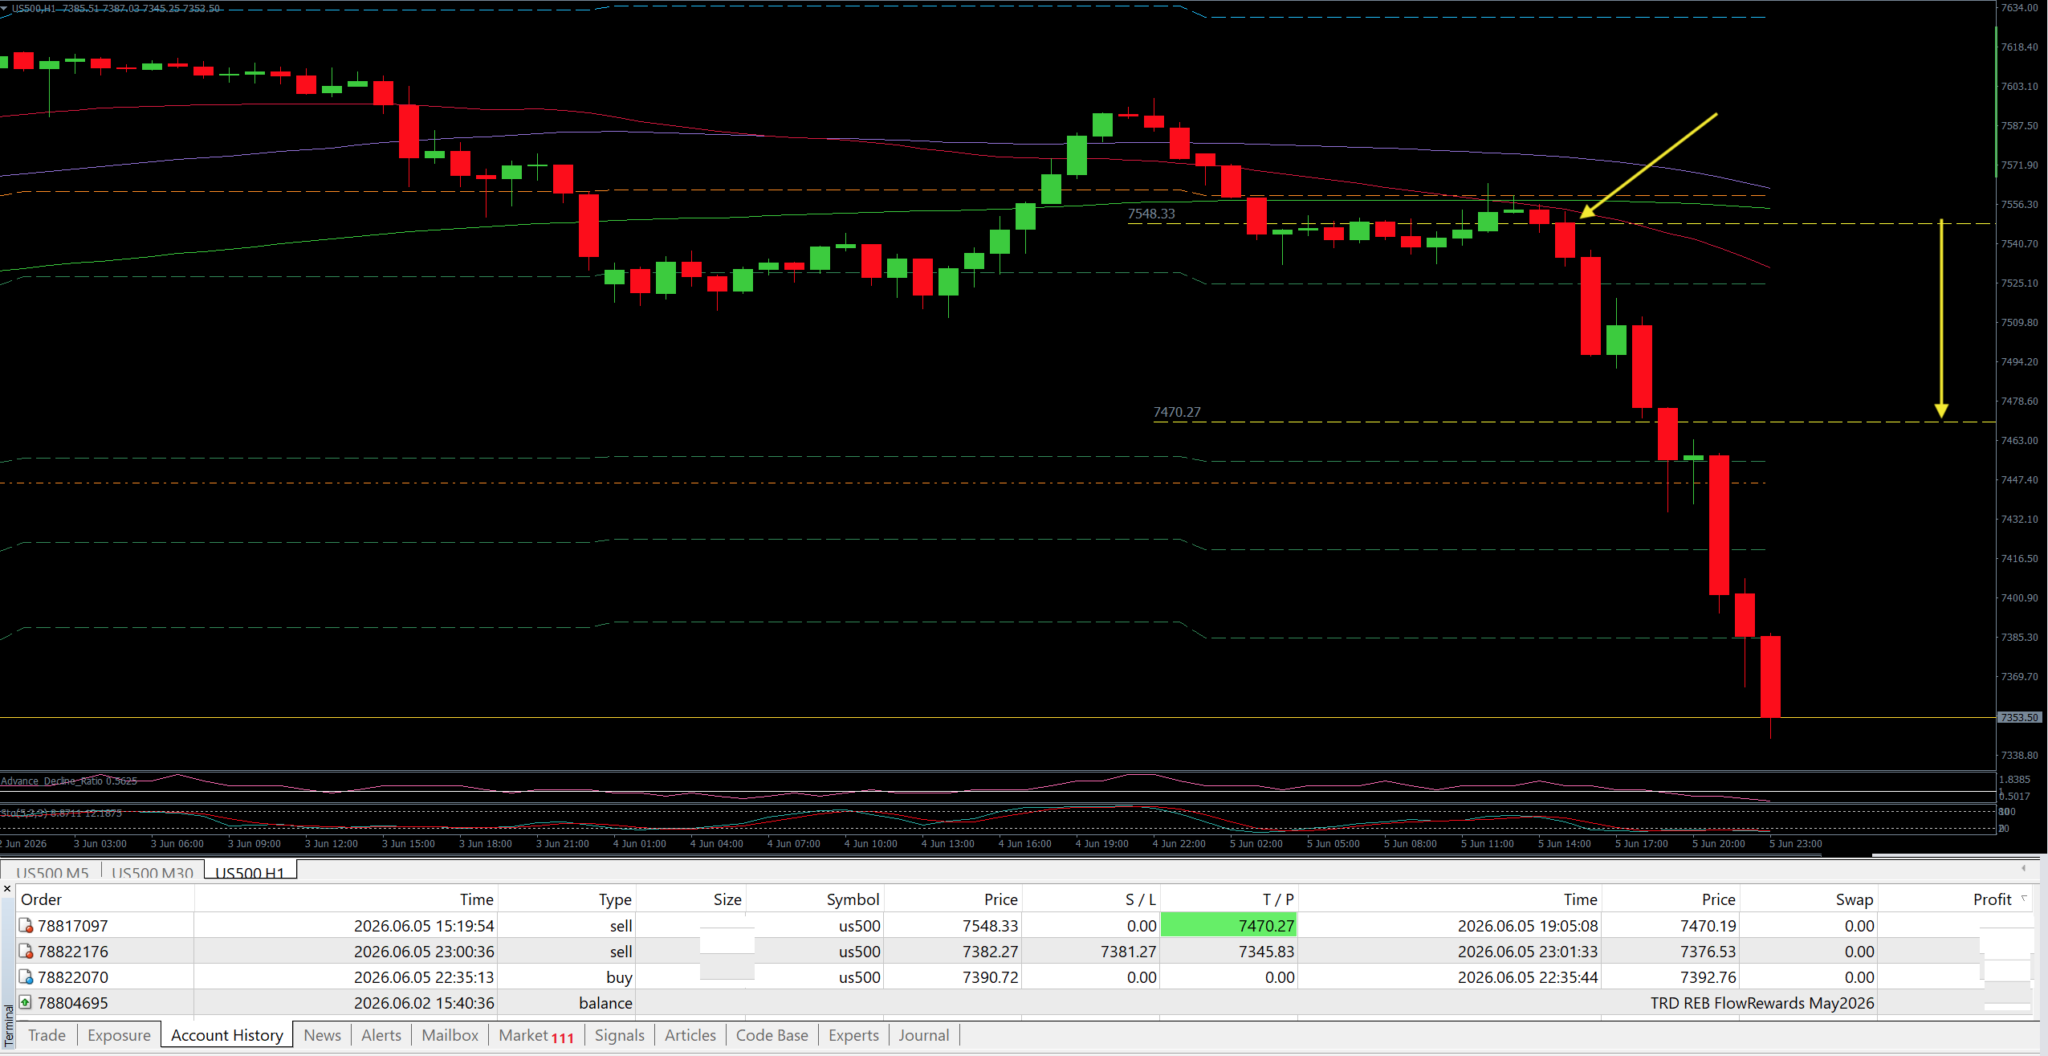
I had to go out for the day so I took a position short and a take profit level. No stop, loss that’s how confident I was about this action. Wow, I’didn’t set it wide enough but it was still a great return.
Risk Warning
— This communication is for information and education purposes only and should not be taken as investment advice, a personal recommendation, or an offer of, or solicitation to buy or sell, any financial instruments. This material has been prepared without taking into account any particular recipient’s investment objectives or financial situation, and has not been prepared in accordance with the legal and regulatory requirements to promote independent research. Any references to past or future performance of a financial instrument, index or a packaged investment product are not, and should not be taken as, a reliable indicator of future results. Max Gold Ltd makes no representation and assumes no liability as to the accuracy or completeness of the content of this publication.